}

CBAM certificate cost, calculated on verified actual values

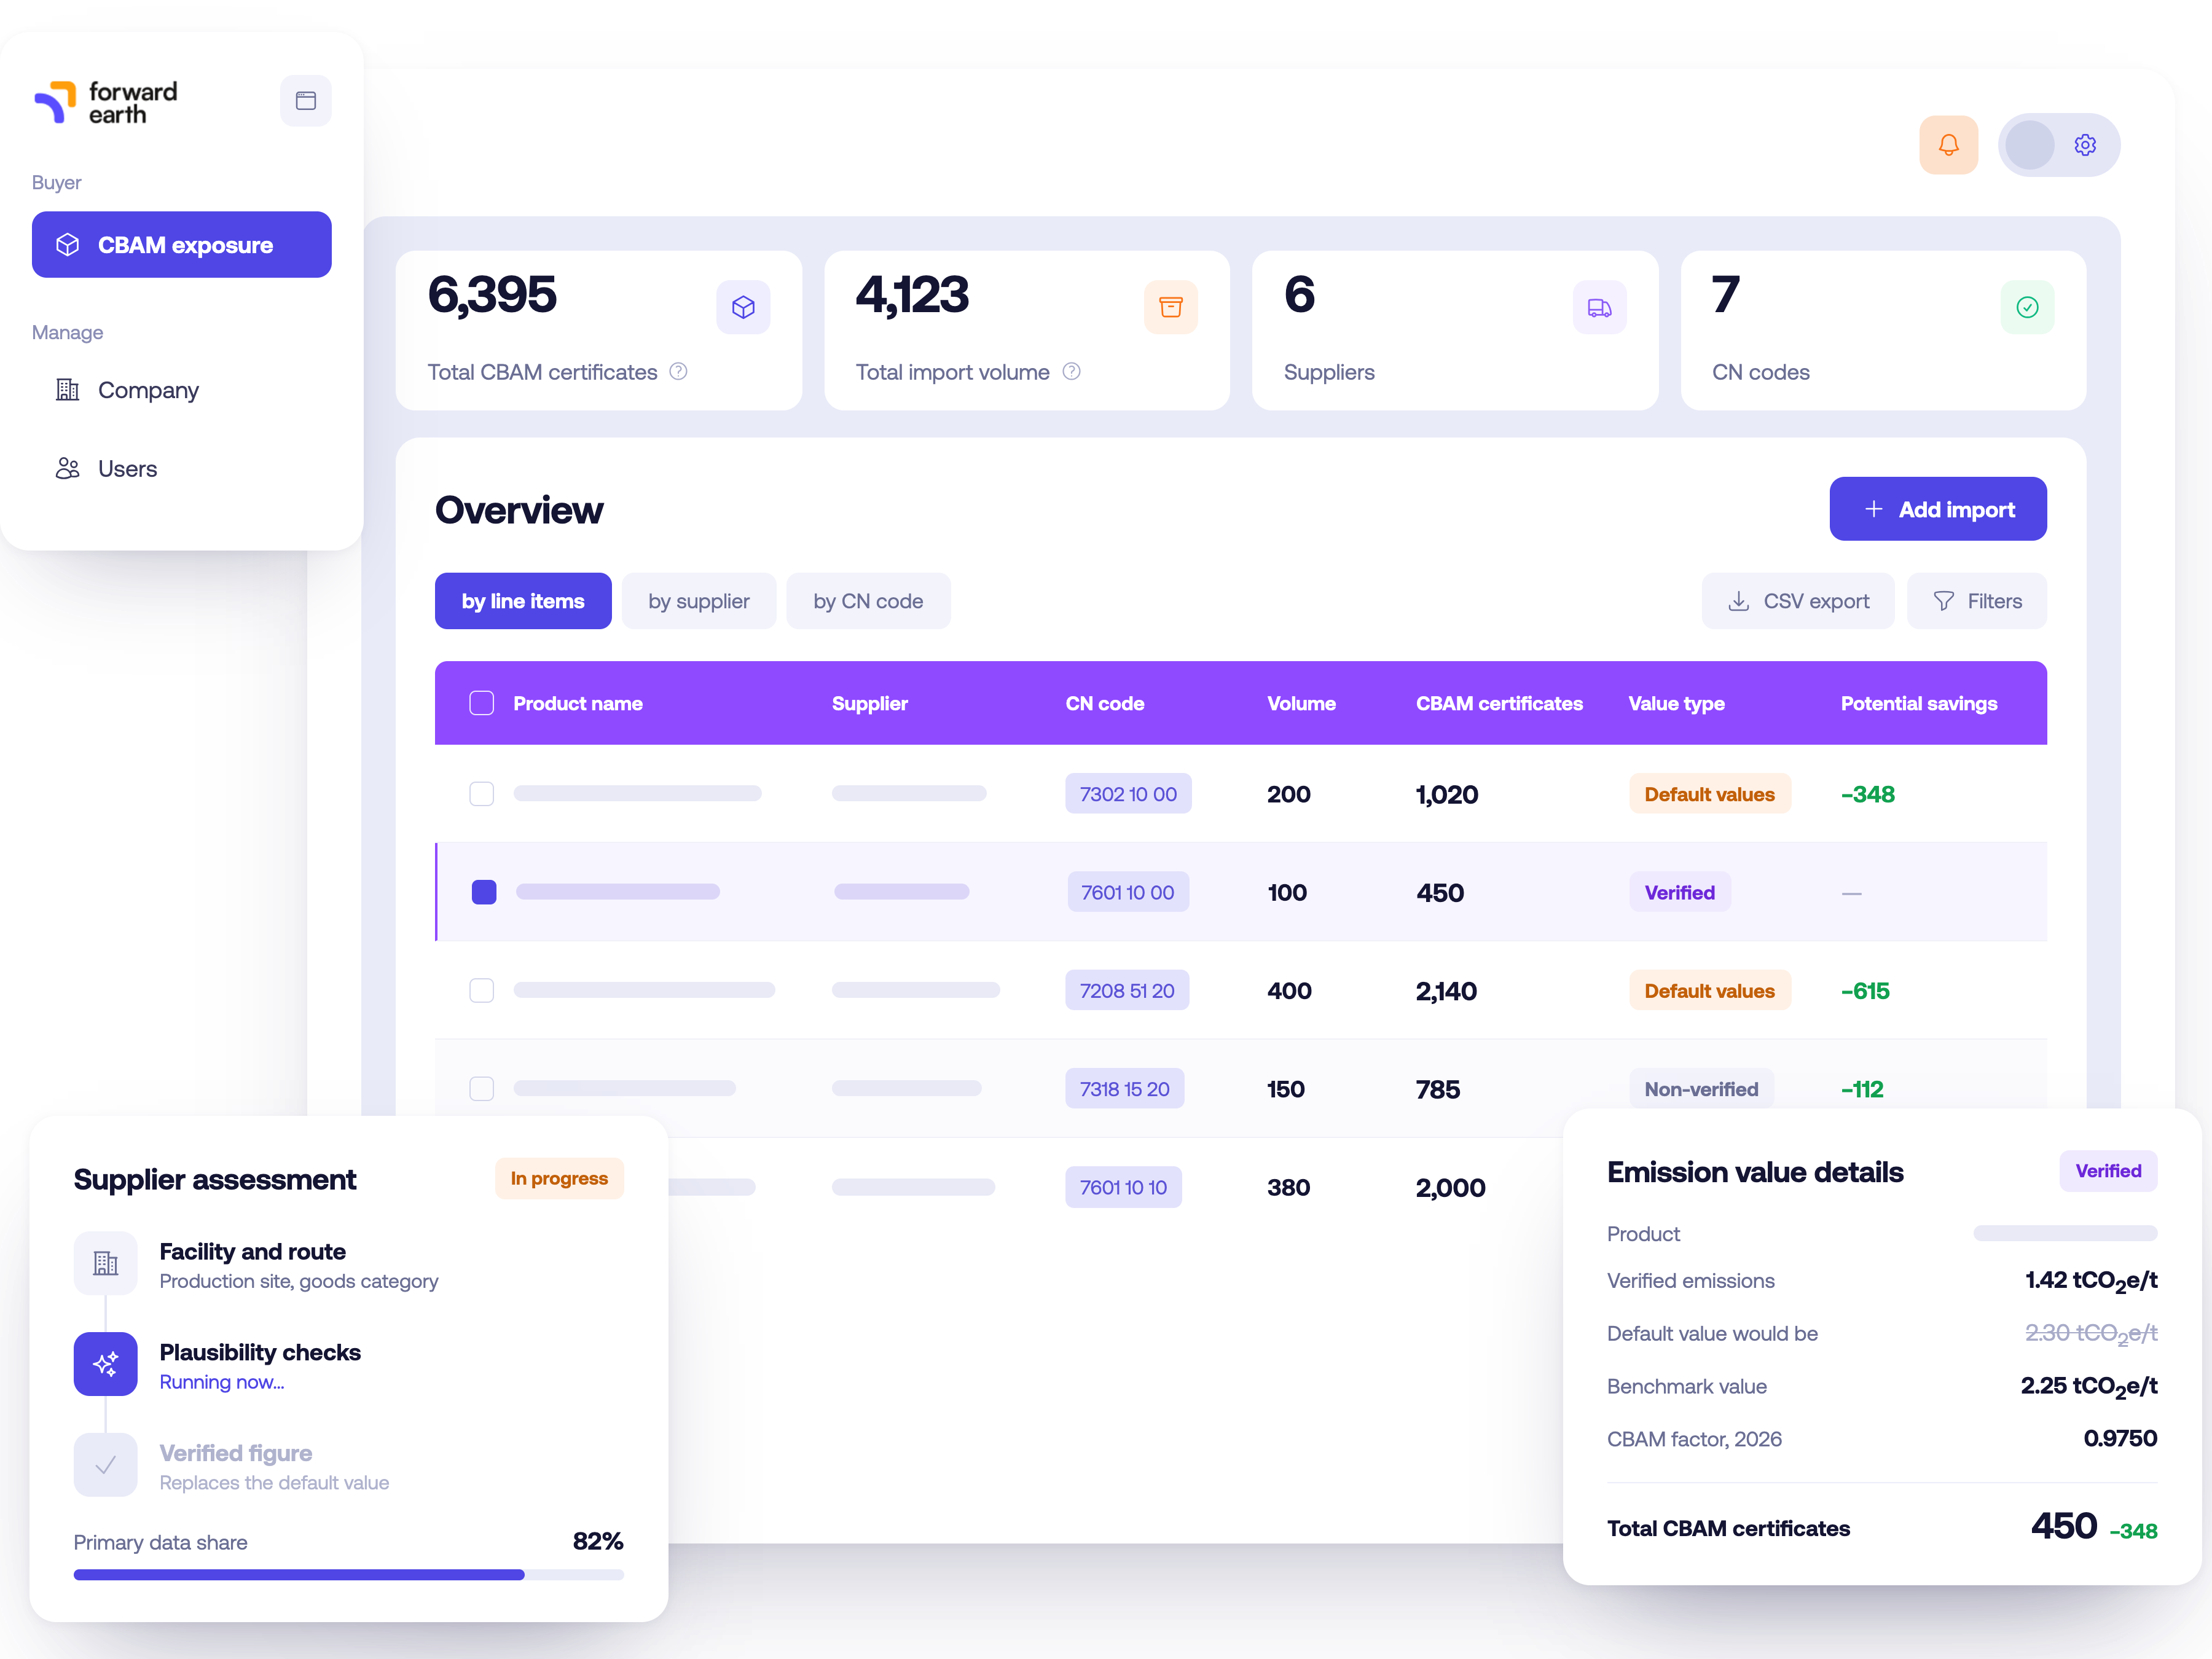
Upload your import data and our CBAM software returns every line with its certificate count, calculated on the EU's definitive-phase default values. Our AI-supported supplier solution then collects as much data as your suppliers can provide, so your CBAM compliance runs on verified actual values, and every default you replace reduces the cost.

Book a demo
Definitive-phase default values (OJEU 2025/2621)
Iron, steel and aluminium, downstream goods included
Compliant with the CBAM methodology

Certificate costs you can defend and act on

The figures your report needs
Certificates calculated per import line, with the totals, plus the supplier and CN-code breakdowns your CBAM reporting draws on.
Verified actual values, not just defaults
The platform collects verified actual values from the suppliers themselves, including the precursors they buy in, so a default value can be replaced with a real figure.
Auditable results
Each line shows the default value, the benchmark, the mark-up and the emissions behind it, so finance can defend the figure and an auditor can follow it.
A trajectory, not a snapshot
Model how exposure develops as the mark-up rises and free allowances phase out, so the number lands in next year's budget while there is still time to act on it.
Default values or verified data, and what the difference costs

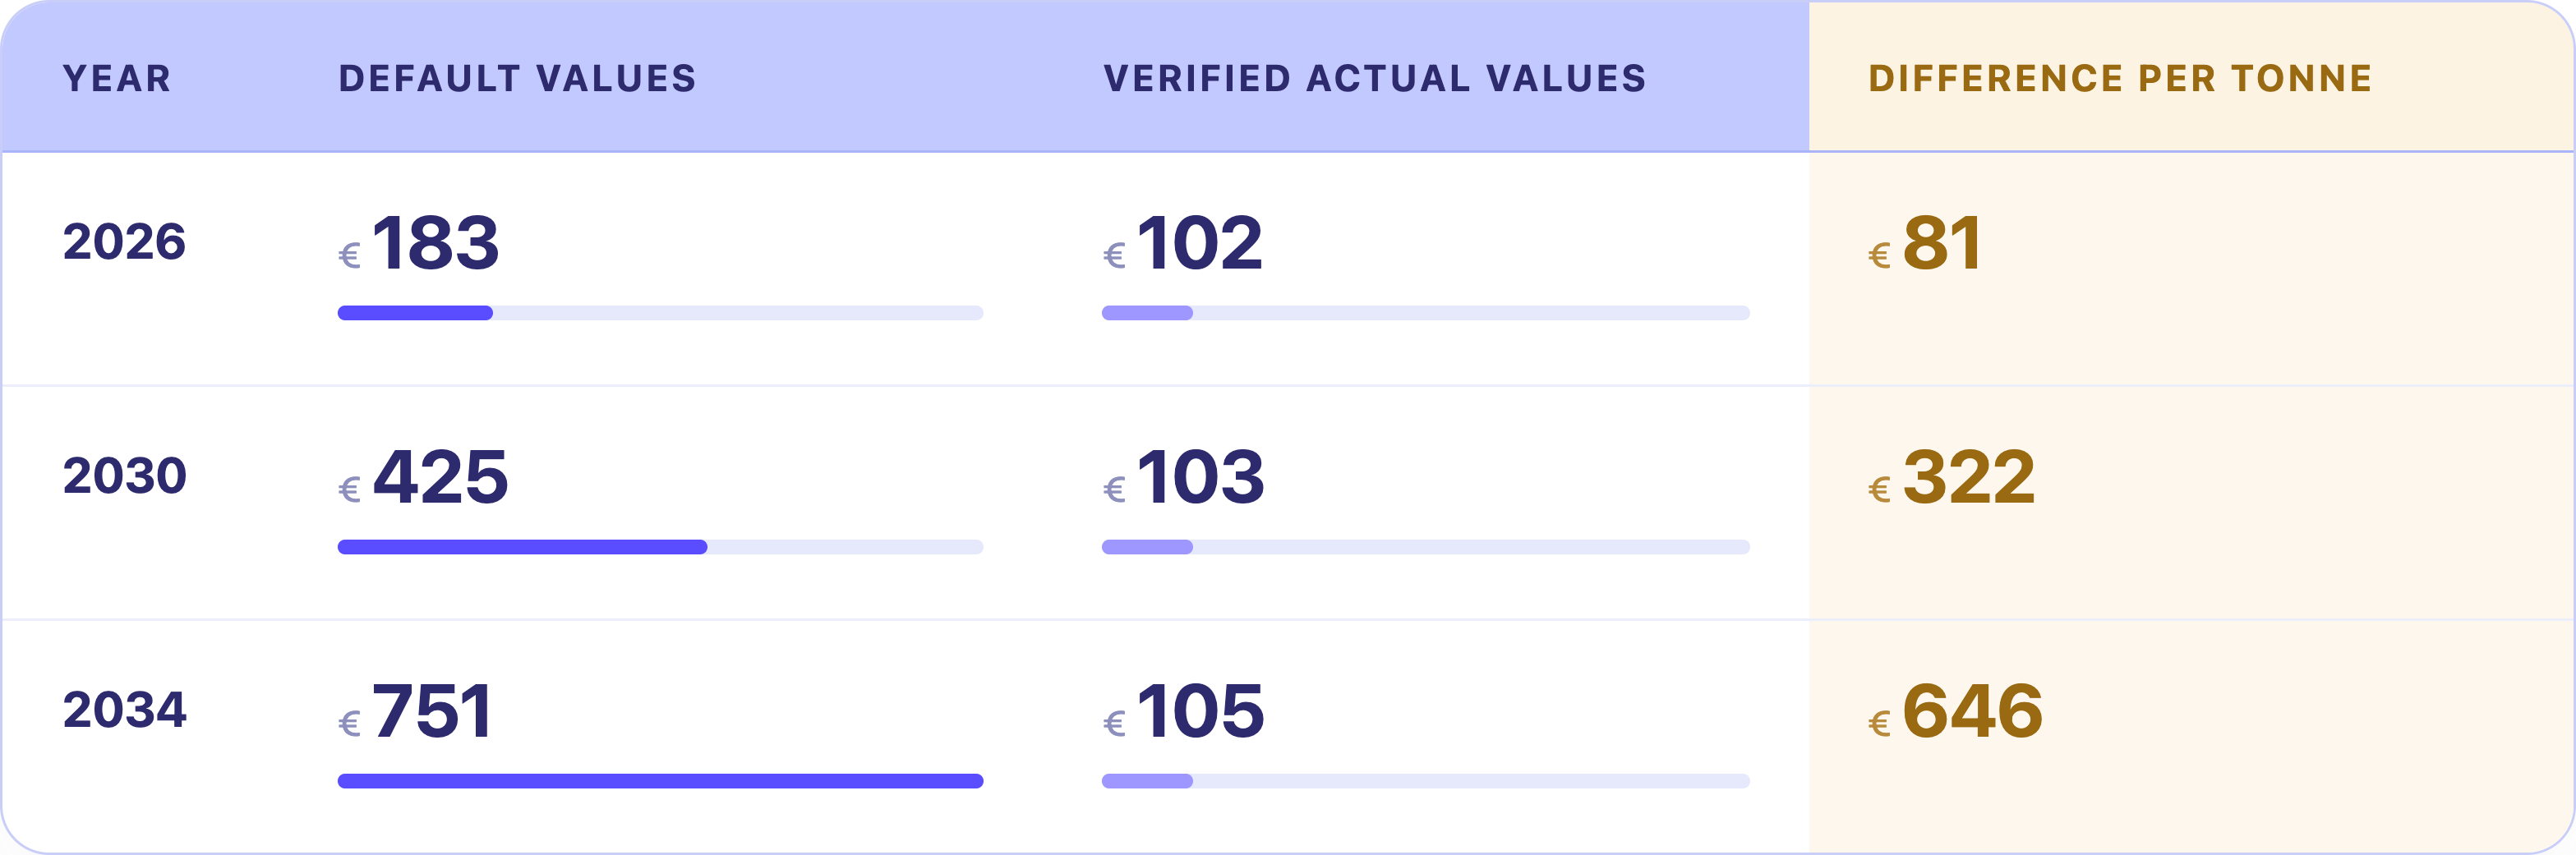
Default values exist to cover missing data, not to reward an efficient supplier. They sit above the country average, the mark-up on top climbs from 10% in 2026 to 30% from 2028, and free allowances phase out to zero by 2034. So an efficient supplier is priced like an inefficient one, and the gap widens every year.
Our own analysis for CN code 7213 10 00, assuming an ETS price of EUR 85 per tonne of CO₂ and a cross-sectoral correction factor of 1. Figures differ by product, country of origin and production route, and verified emissions do not always come in below the default.
CLOSING THE GAP

We put a number on both columns.

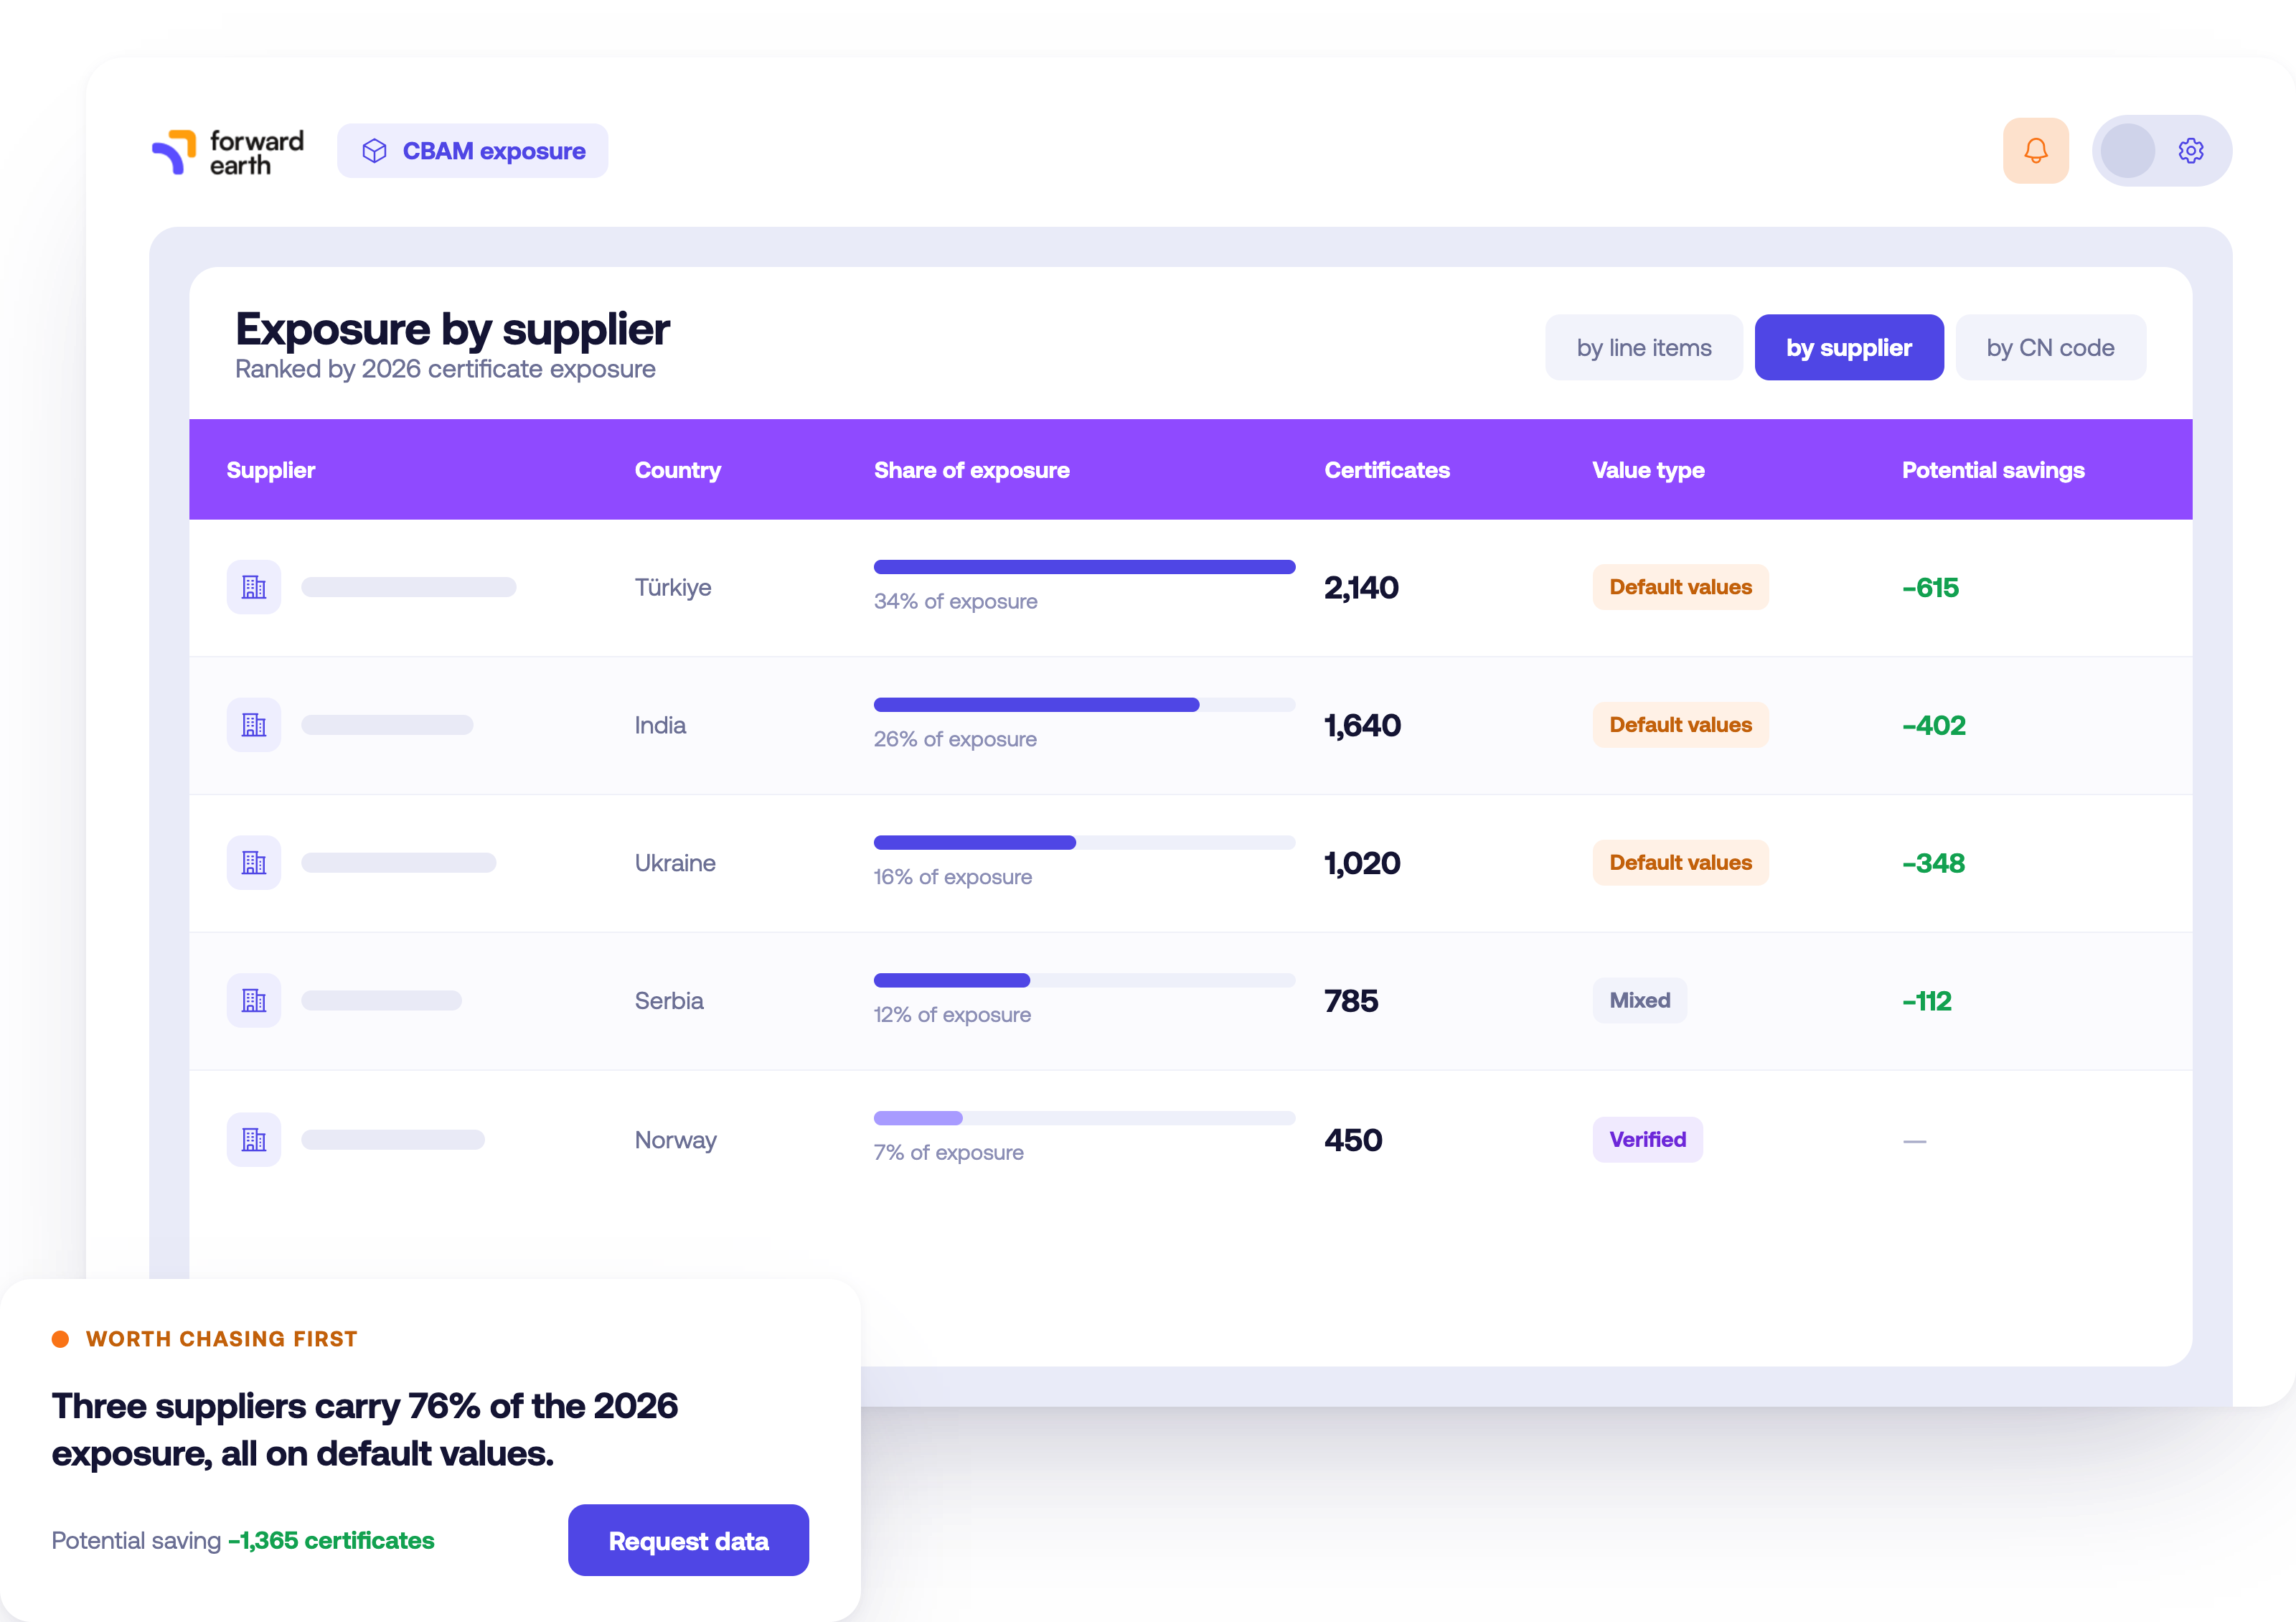
The platform calculates the default-value exposure for every import line today, and the supplier and CN-code views show which lines are worth chasing verified data for. The 2026 exposure is being set by the imports going through right now, so the ranking is worth having before the next shipment, not after the bill.

How our AI-powered software gets the job done

A clear workflow from a customs export to a certificate figure, and from a default value to a verified one.
QUANTIFY THE EXPOSURE
Start from the customs data already on hand, and find the lines that carry the cost.
1
2
3
4
5
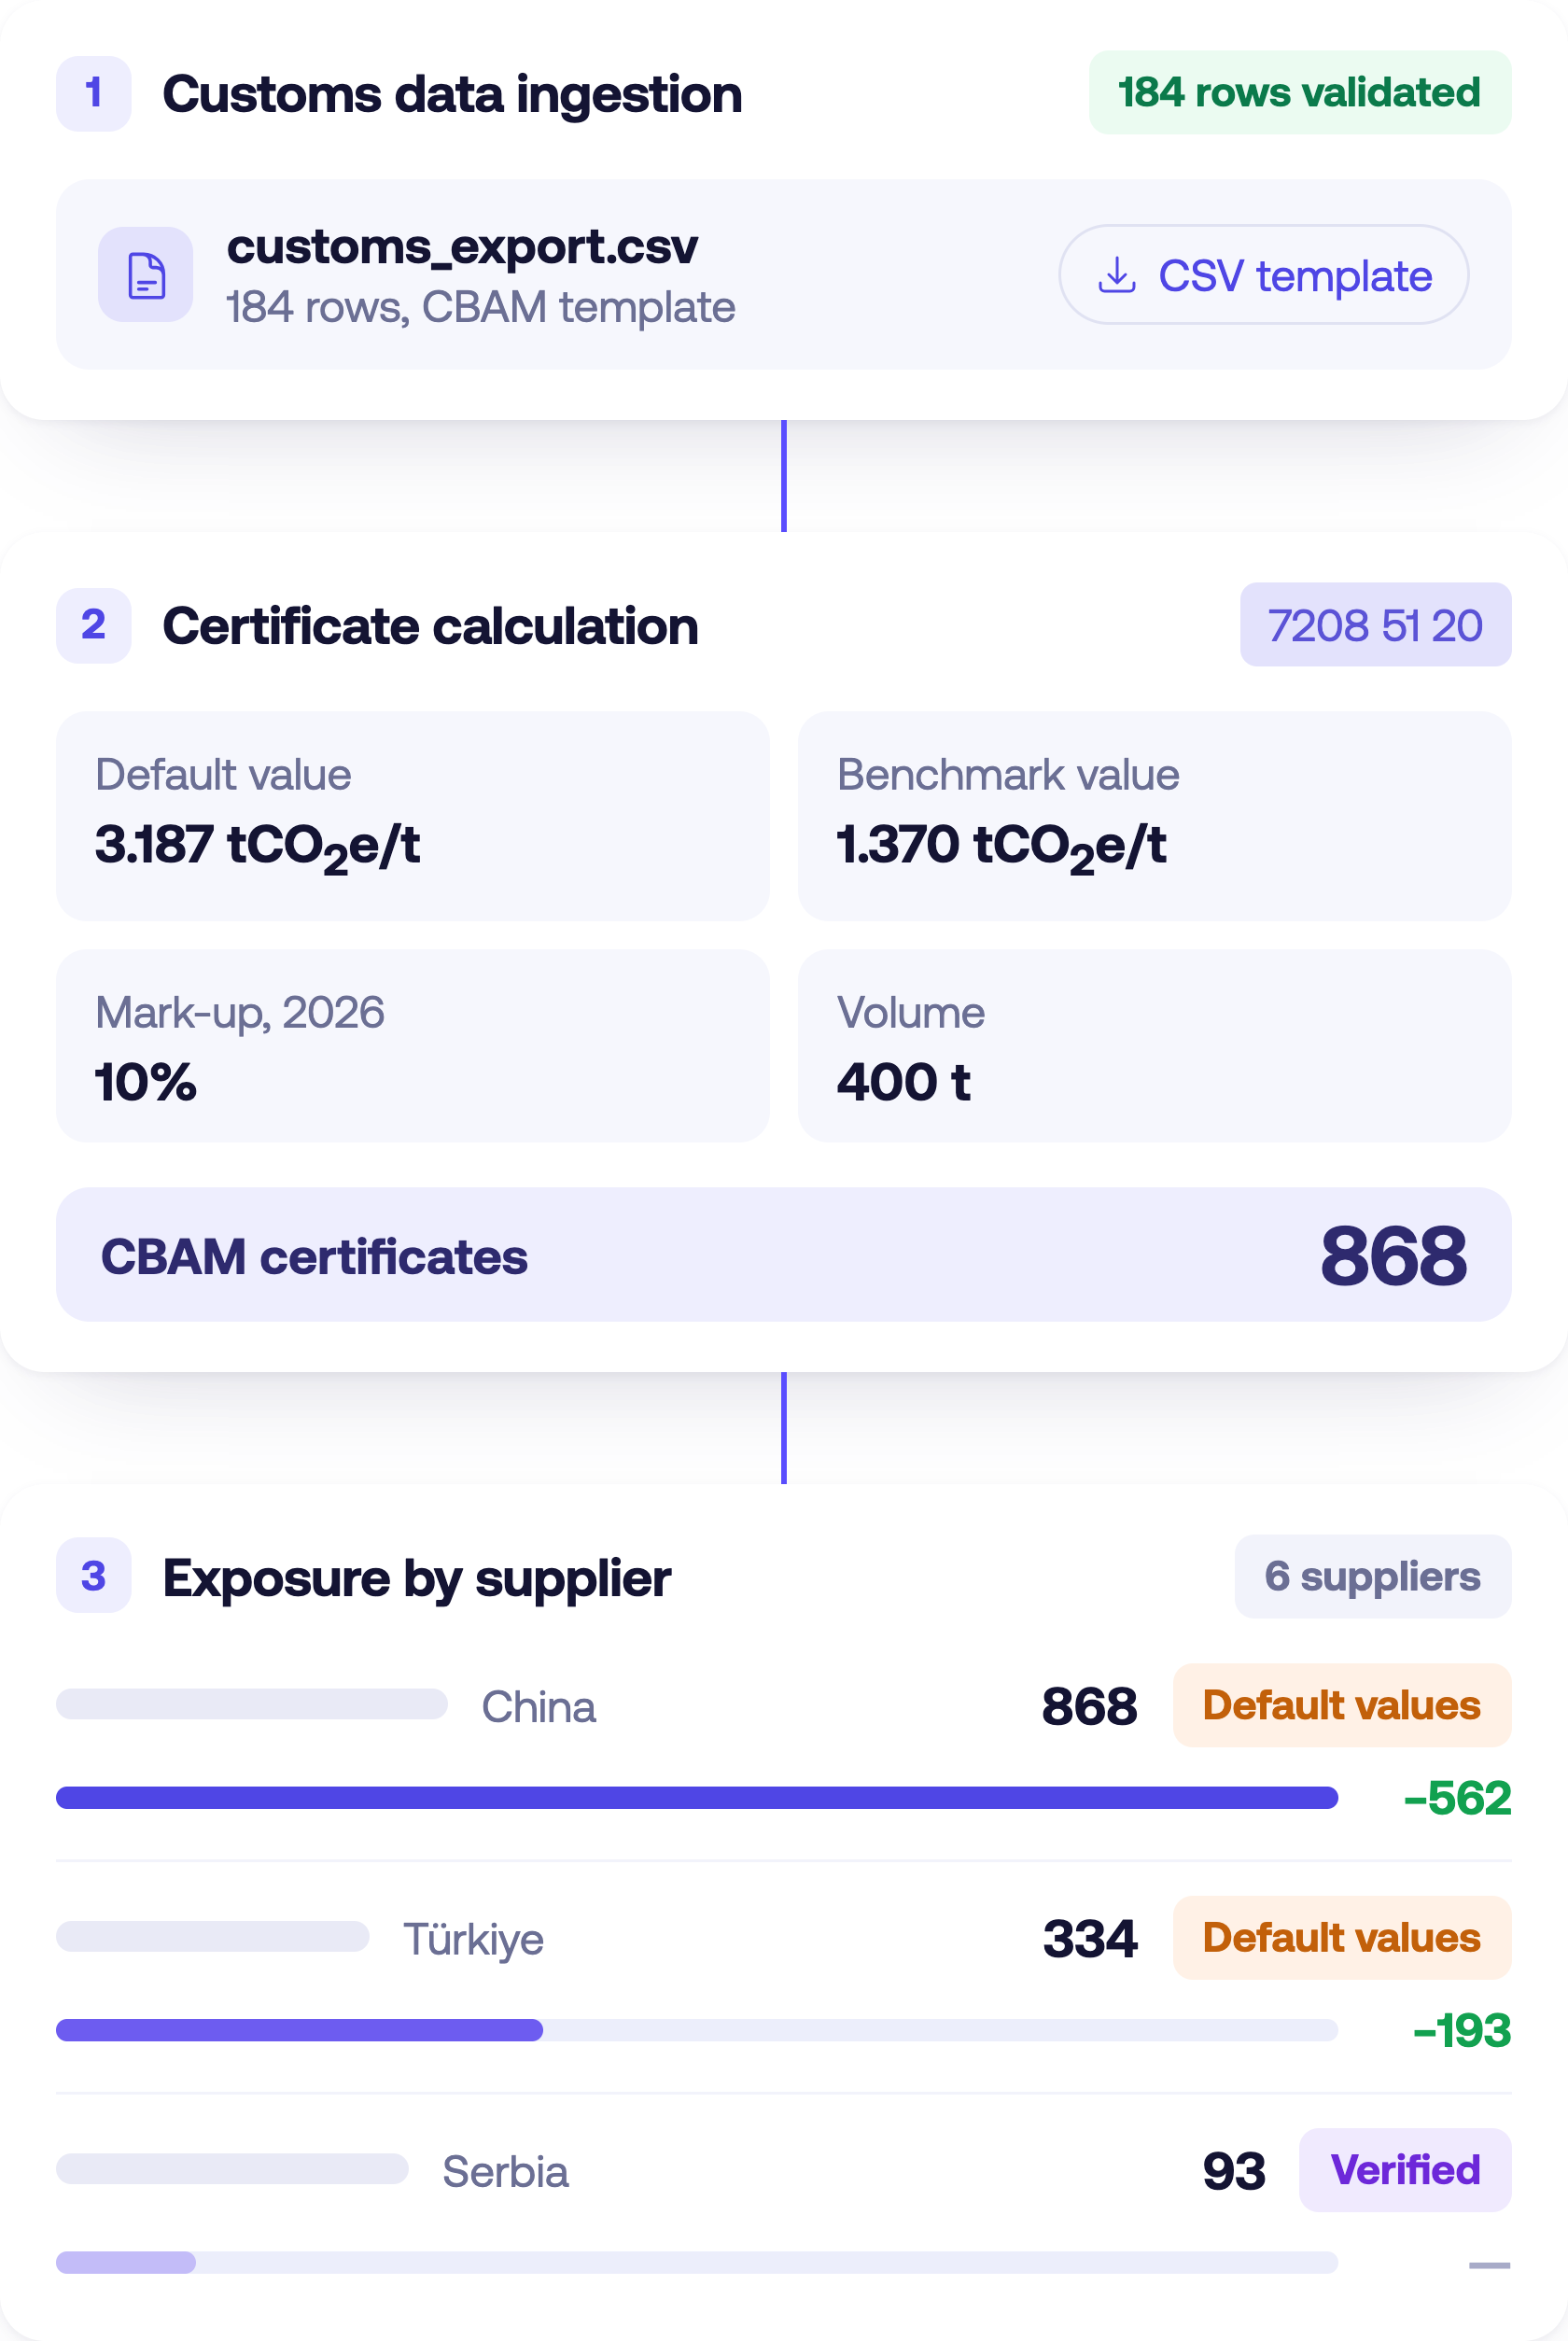
Customs data ingestion
Map your customs or import file to our CSV template, up to 200 rows per file.
Scope and validation
We check every row on upload and match each CN code you provide against the covered list, so anything outside CBAM drops out before the calculation runs.
Certificate calculation
We calculate certificates per import line using definitive-phase default values, the benchmark for free-allocation adjustment and the mark-up for the year, with every data point visible.
Hotspot analysis
Move between the line-item, supplier and CN-code views to see where the cost sits.
Report and export
Export the figures your CBAM report needs, plus the totals for budgeting and balance-sheet provisioning, or use the ranking to decide which suppliers to ask for real data first.
COLLECT THE VERIFIED DATA
A procurement analyst works in the AI agent she already uses, no new tool to learn.
1
2
3
4
5
6
Product request
An importer's request reaches the supplier, by partner integration or manual onboarding.
Facility setup
The production site goes in with its location information.
Guided assessment
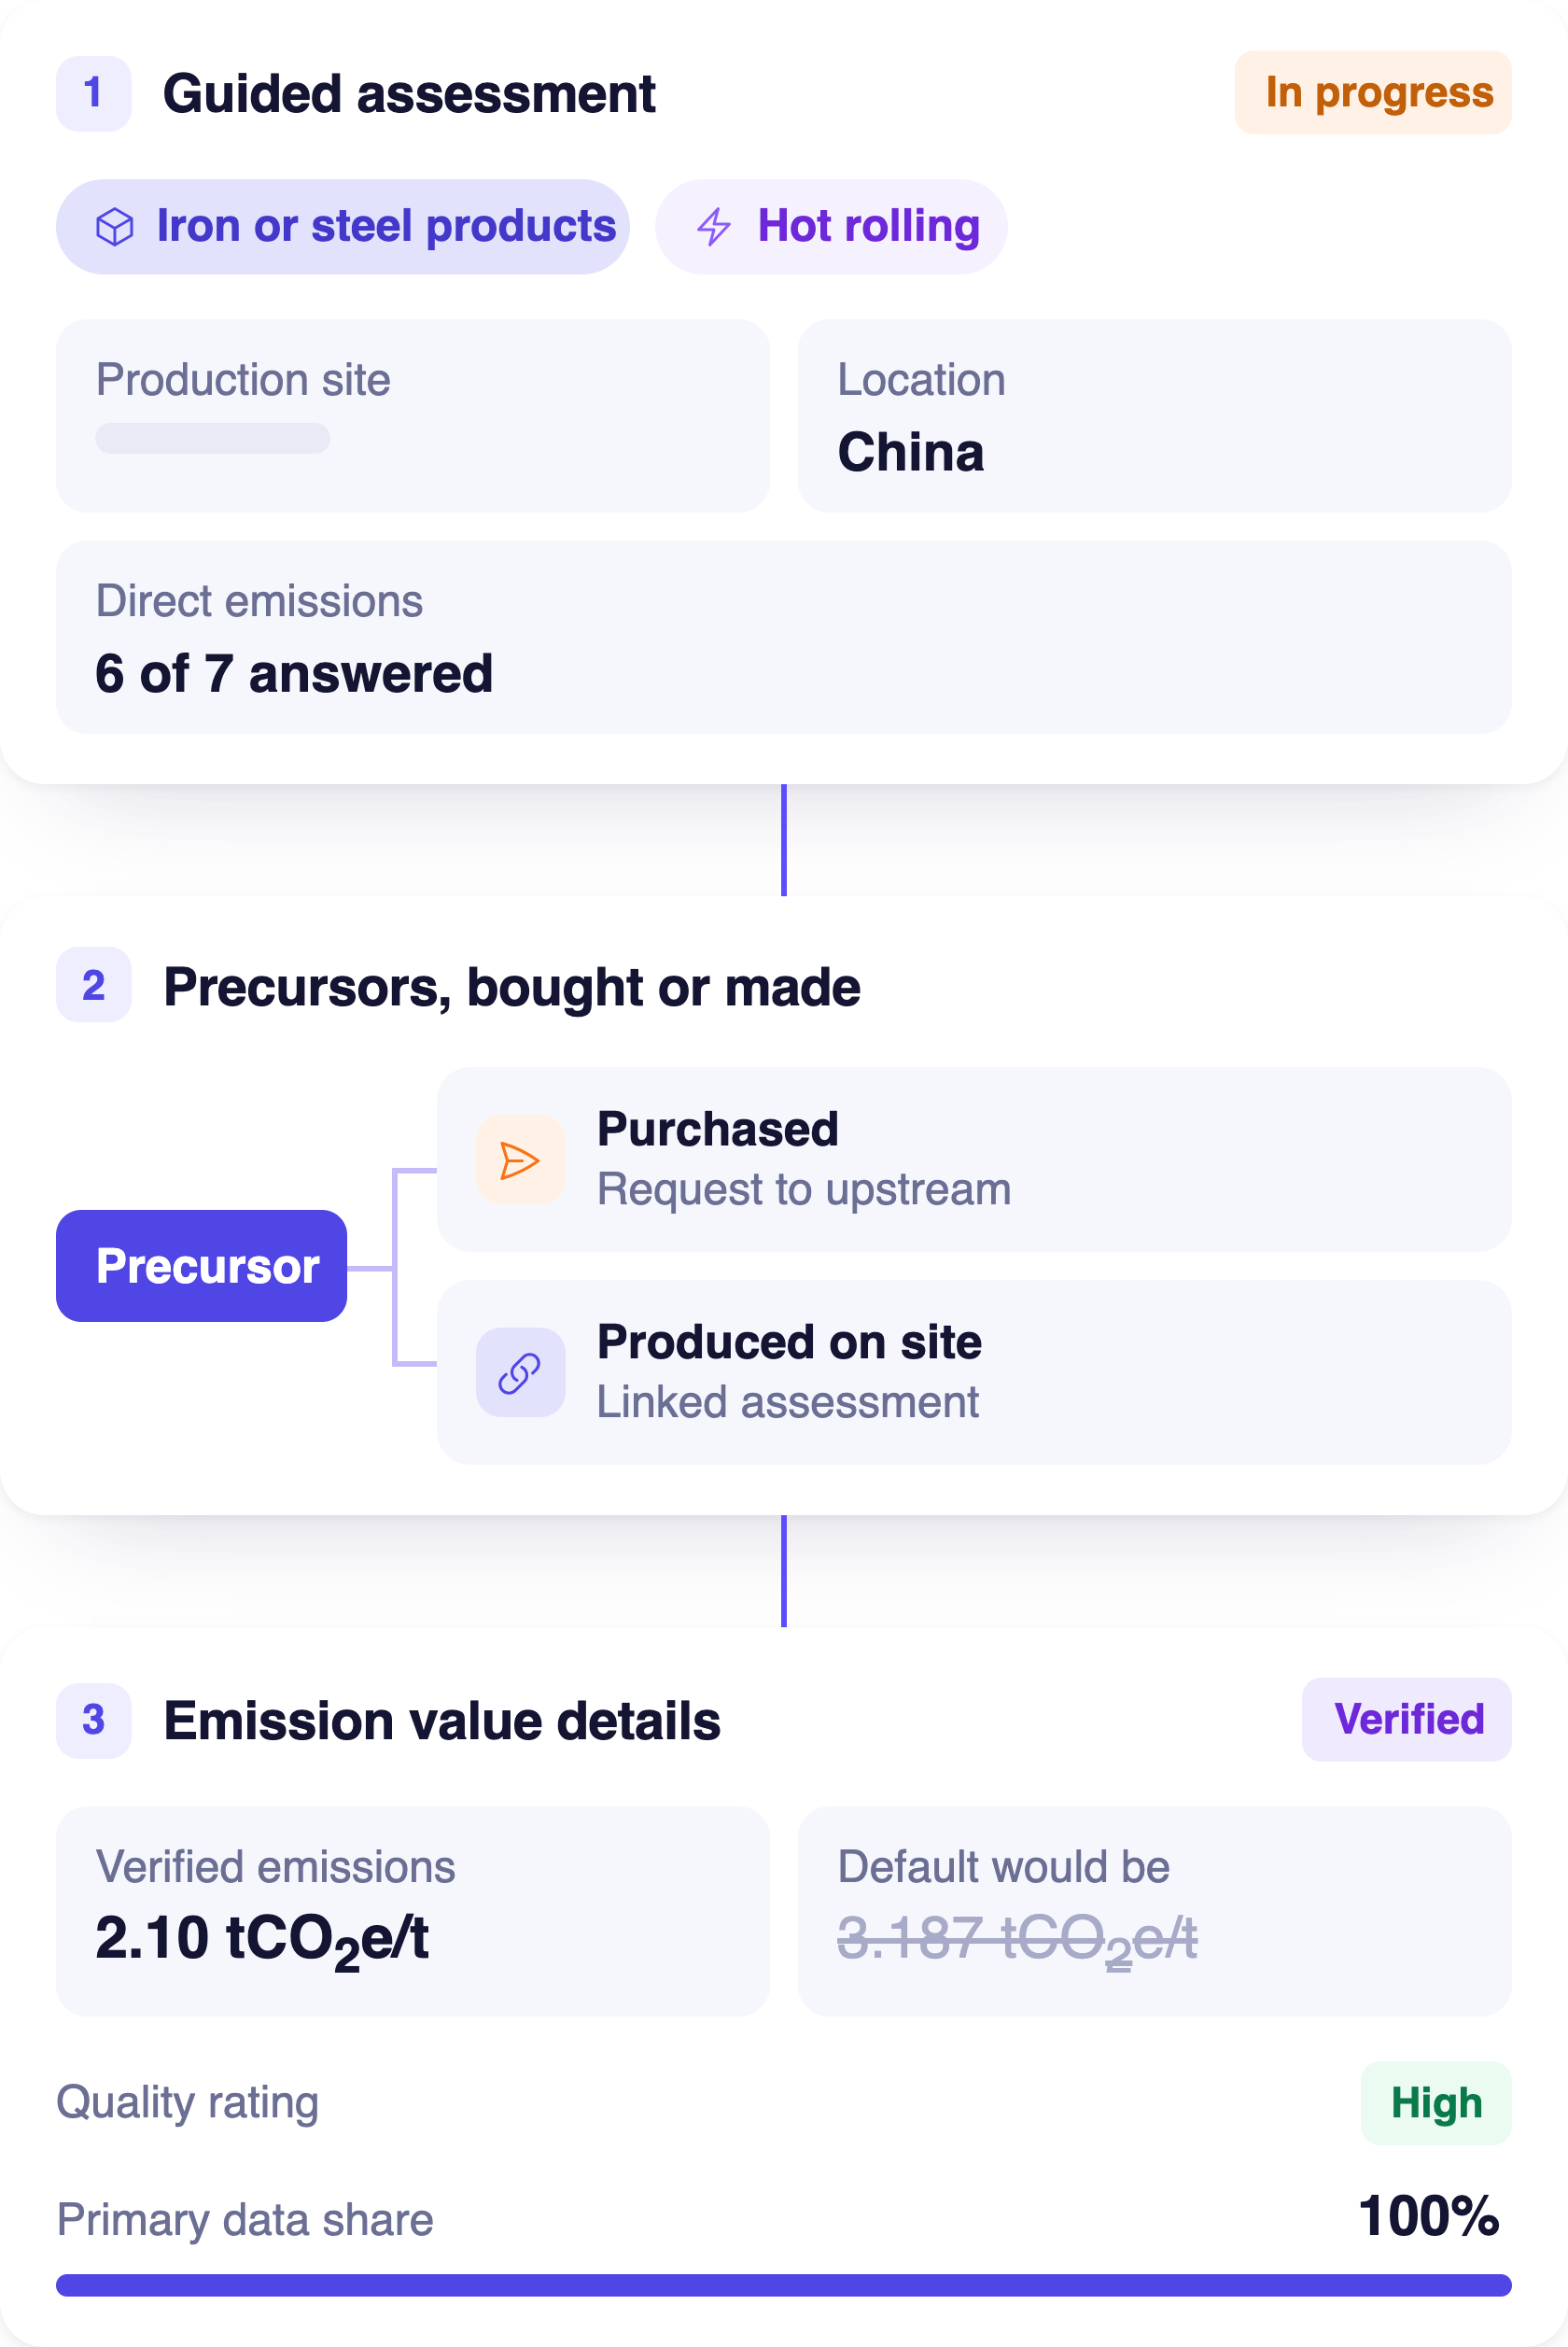
Data collection follows the aggregated goods category and production route, so the supplier answers only what applies to its direct and indirect emissions. Regulatory defaults fill any gaps, and the figure sharpens as real data arrives.
Precursors, bought or made
Bought-in precursors trigger a request to the supplier's own upstream suppliers. Precursors made on site link to their own assessment, modelled rather than estimated, and are reused across facilities.
Plausibility checks
Our AI checks the data for completeness, consistency, outliers and deviation from the regulatory benchmarks, then flags each issue with a severity. Every result carries a quality rating and a primary data share, so the importer sees how much of the figure rests on real data. 
Verified figure and export
Export results or push to a partner platform via API. The verified figure replaces the default in the importer's calculation.
Every verified figure that comes back re-runs the calculation in the first block, so the exposure you start with is not the one you pay.

Ready to get
the job done?

Get a tailored demo with a specialist and see
how we make carbon management simple.
Book a demo